

Ingestion
Ingestion was measured with p8s-bench, a harness around VictoriaMetrics’ prometheus-benchmark tool. The load generator produced samples for 5,100 targets every 60 seconds, for a total of ~3.3M unique active series. On a singlem5.xlarge node (4 vCPU, 16 GB RAM) with SlateDB’s WAL disabled,
Timeseries sustained:
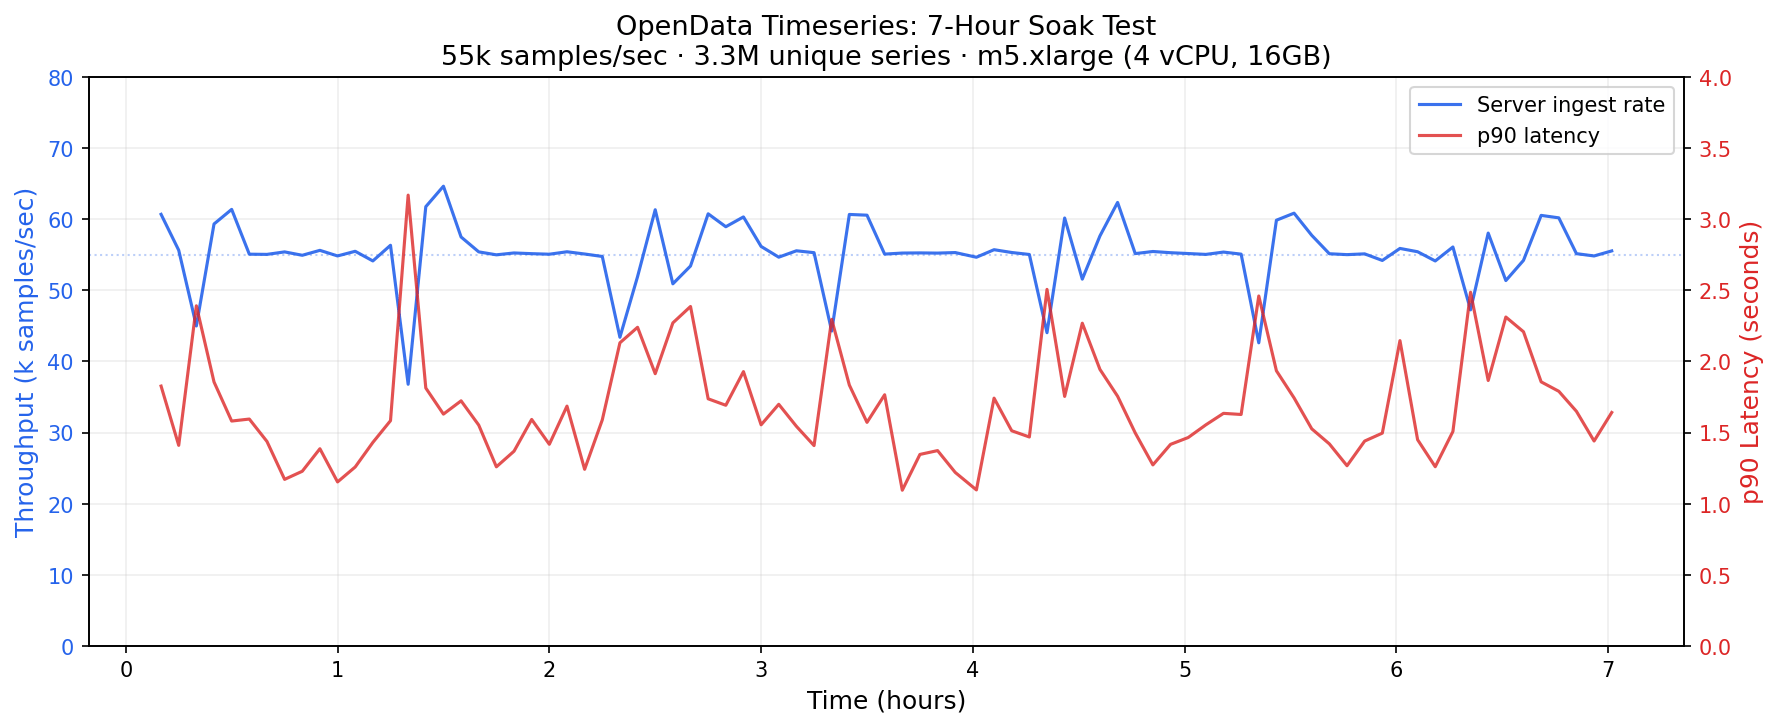
Sustained ingestion rate over the soak test on a single m5.xlarge node.
Query latency
We measured query latency by replaying 18 queries from a production Grafana instance over a 6-hour range at 15-second resolution, against a singlei4i.xlarge reader (4 vCPU, 32 GB RAM, NVMe disk cache) running v0.4.0. The
chart groups queries by the number of series they match and plots the median
latency per group.
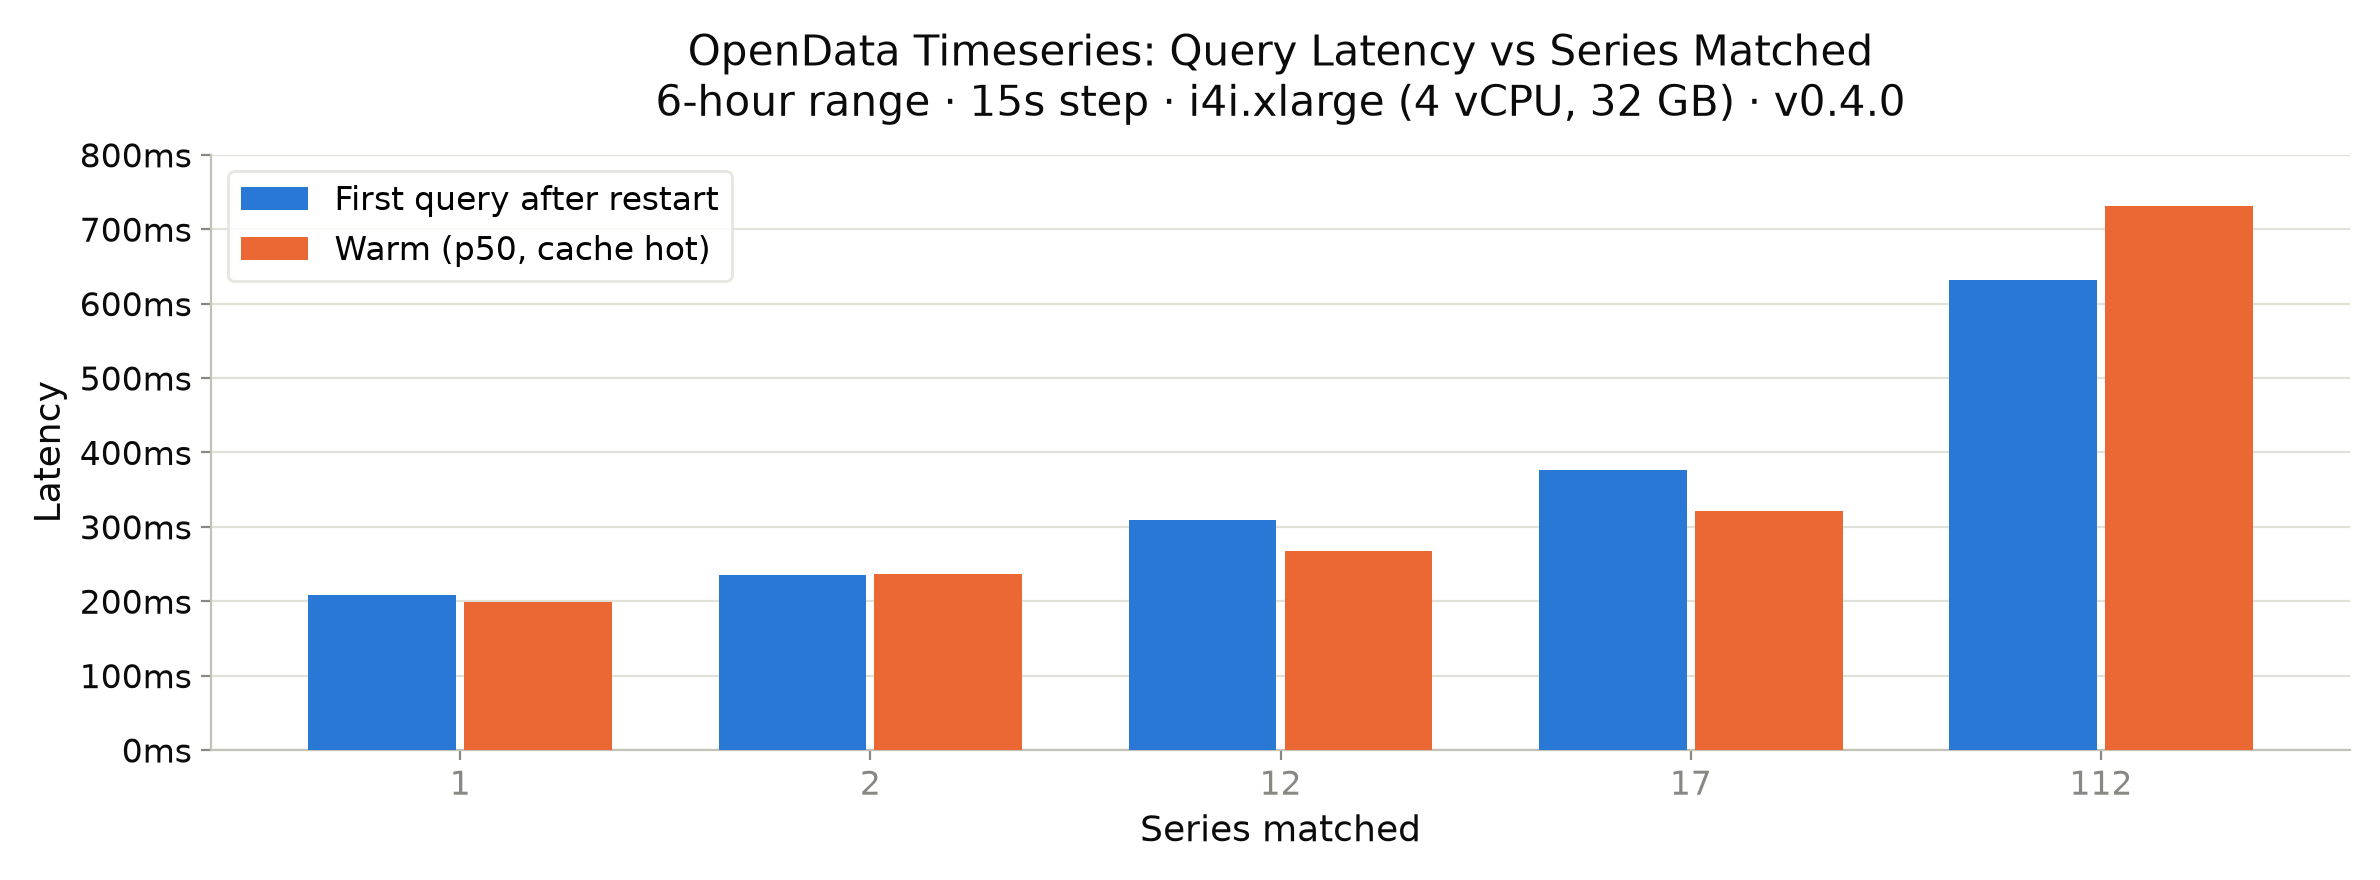
Query latency by number of series scanned over a 6-hour range: first query after a restart vs. fully warm.
Cost
The same workload (3.3M active series, 4.7B samples/day) costs roughly $560/month of compute:Reproduce it
- Ingestion harness: p8s-bench
- Underlying tool: VictoriaMetrics prometheus-benchmark
- Storage design: Timeseries storage design and the TSDB storage RFC